|
Small Portfolio
|
XLF & IAU
|
16.16%
|
|
|
Position
|
Date
|
Return
|
Days
|
|
DECK
|
6/15/2012
|
-36.88%
|
141
|
|
RIMM
|
7/16/2012
|
20.14%
|
110
|
|
OKE
|
9/25/2012
|
-3.77%
|
39
|
|
SEAC
|
9/25/2012
|
8.20%
|
39
|
|
CAJ
|
9/25/2012
|
-7.88%
|
39
|
|
DDAIF
|
9/25/2012
|
-8.67%
|
39
|
|
SSD
|
9/25/2012
|
1.14%
|
39
|
|
NSC
|
10/8/2012
|
-7.90%
|
26
|
|
WMK
|
10/22/2012
|
0.59%
|
12
|
|
CFI
|
10/31/2012
|
0.00%
|
3
|
|
S&P
|
Annualized
|
3.59%
|
|
|
Small Portfolio
|
Annualized
|
11.31%
|
|
|
Large Portfolio
|
Annualized
|
15.80%
|
Scheduled rotation: selling SSD; buying CGX.
The new purchase, CGX, is the first based entirely on the
new adaptive fundamental feature. Quite
honestly, when I look at this stock, it looks horrific. Scares me about as much as RIMM did when I
bought it.
Since my gut instinct is about as bad as it gets, that may
be a good sign…
I feel like I’m George Castanza trying to succeed by intentionally
doing the opposite of what I want to do.
In the same vein, SSD (in the building industry) is
something that I would expect to benefit from Hurricane Sandy. We do, after all, have a lot of rebuilding to
do up here.
This is one of those trades that I have to throw up my hands
and hold my breath to see what happens.
NEXT SUBJECT:
Just to clarify my earlier note – the “Annualized” return
percentages are calculated from the time that the model went live with real
money, 5/31/2012. The total returns from
that time are:
|
S&P
|
Return
|
5.13%
|
|
Small Portfolio
|
Return
|
16.16%
|
|
Large Portfolio
|
Return
|
22.58%
|
So, the 22.58% return from 5/31/2012 translates into an
effective annual return rate of 15.80%.
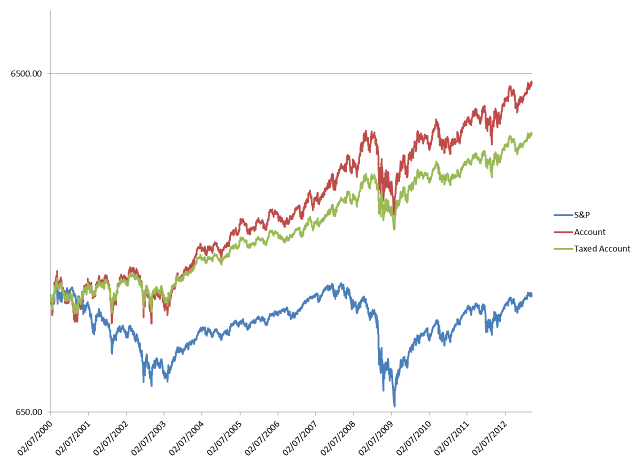
This corresponds to the return rates that were back-tested
for the Sector rotation model from 2/07/2000 through 10/22/2012. The following graph shows the S&P 500
index compared to the sector model returns for a regular taxed account (in
green) and an IRA account (in red):
Tim

No comments:
Post a Comment