Showing posts sorted by relevance for query quantifying bernanke. Sort by date Show all posts

Monday, January 20, 2014

1/20/2014 Calculating the Effect of the QE Taper on S&P valuations

Bernanke has declared that all quantitative easing should be tapered to zero by the end of 2014.  But Bernanke isn’t going to be in charge.  We cannot know what Yellen will do.

With nothing else to go on, though, let’s assume that the taper follows Bernanke’s declaration.  Will the world end?

These three sites certainly think so:


But if you’ll look carefully at those sites, not one of them is using any kind of model to show what the S&P should be under normal circumstances.

By normal circumstances, I mean – driven by the economy.  The market hasn’t had much to do with the real economy since 2008.  Oh, corporate earnings are through the roof, but folks aren’t working.

So, what WOULD an economically driven market look like?

Ugly:


The basis for the “demographic projections” is the ratio of working age to non-working age citizens.  I’ve used this ratio much like an Earnings Yield to develop a long term Demographic Yield.  If people drive economic growth, then demographics can be used to estimate future growth based on existing birth rate records.

The model works well from 1985 until 2009 – when Quantitative Easing skewed valuations.  Instead of people creating money, Bernanke just started printing it.

But what happened to the people to throw us into a path that could have led to another Great Depression?

To put it bluntly, the baby boomers aborted 50 million babies and there aren’t enough people to pay for their retirement.

This would have looked like a Greek Tragedy had not Bernanke pulled his Deus ex machina to save the day.

I’ve measured the effects of QE in a previous post.


Basically, QE is the difference between that scary looking red line and the happy blue line we’ve actually experienced.  It’s like the difference between the red pill and the blue pill in the Matrix.

In any case, now that we are facing the taper, what the HECK should it look like?

For that, we need some hard data about the Fed’s balance sheet:


Here’s a graph:


Until the economic crisis, the Fed balance sheet was expanding at something similar to the rate of the economy.  The average for 2003-2008 was 4.67% a year.  Then – BOOM! – by 2009 we had a whopping 149% increase, and it keeps on going.  Just last year the Fed balance sheet increased by 38.74%.

If Bernanke’s taper prediction comes true, 2014 will STILL see an increase in that balance sheet by another 13.96%.

After that, my best case scenario would be for the Fed to maintain that balance sheet until 2024:


I’ve updated the S&P projection graph to incorporate Bernanke’s proposed taper, and MY proposed maintenance of the balance sheet until a 2024-2034 withdrawal.

The current projection also includes a normalized increase in the balance sheet by 4.67% each year until that withdrawal.

Given those ideal conditions, we would see something like this for the S&P (note the higher numbers from previous estimates to include the entire projected QE):

2015
2050.71
2016
2101.69
2017
2326.07
2018
2508.94
2019
1763.98
2020
2360.19
2021
2149.77
2022
1862.23
2023
1480.70


Now you see why I suggest we maintain the balance sheet until 2024.  Can you imagine the S&P back under 1500 even MAINTAINING the current balance sheet?

It would be far worse if they reversed all QE and worked down that balance.  The S&P in 2023 would be well below the March 2009 apocalyptic value of 666, and would likely go post-apocalyptic to something closer to 400!

Let’s assume the good Janet Yellen isn’t fired in 2016 by a President Rand Paul… and the sun and moon don’t fall from the sky…

Given that ASSUMPTION, there IS a slight demographic uptick in the working age / non-working age ratio between now and 2018.  That means we should have moderate economic expansion.

Hence, the taper.  That is – the S&P could go above 2500 by 2018 even if we taper QE to zero.

Of course, we do not know, and CANNOT know, what the Fed will ultimately do.  I’m only showing the range of options between a sane taper and an insanely premature reversal.

I keep saying this, but cannot say it enough: don’t fear the taper!  Any REVERSAL before 2024 would be disastrous – but no one is talking about that yet, and it won’t happen this year or the next.

2016, though, brings another Presidential election.  We elected a left wing ideologue, and we’re surviving it.  But please – no more ideologues.  Too far to the left and we’ll get massive inflation in the NEXT decade.  Too far to the right and we’ll get massive deflation in THIS decade.

If I were Bernanke, I’d be retiring too.  At some point it’s beyond his hands.

And may God have mercy on Yellen’s soul.

But we’re okay this year and the next.  We’ll have some scares, and I expect a good correction to make most investors wet their pants.  But the sky won’t fall, and the ground won’t swallow us up – at least, not yet…

Now for some caveats:

These are just estimates on a model.  I’m using the Fed balance sheet as a multiplier on my own Demographic Secular Model.  This appears valid in the 2008-2014 time period, but that’s too short a time to truly qualify as a multiplier on a secular model (which by definition works in sequences of decades rather than years).

Even if valid, the numbers are mere approximations.  As you can see on the first graph (above), even the most accurate projections are never a bullseye.

You cannot, therefore, use such long term estimates to do any kind of short term timing.  I’m “timing” in decades instead of years.  We face the continued threat of deflation in this decade, and the threat of inflation in the next.

That’s really about as far as anyone can go.  The purpose of this post is NOT to say what the market must do, but rather to answer the common fears in recent articles that the taper will bring immediate disaster.  Disaster would require something far more than a taper; it would require full reversal of QE and an elimination of the Fed balance sheet – something which must not occur until the 2024-2034 time period.

Tim


Friday, May 17, 2013

05/17/2013 Quantifying Bernanke


Last week we looked at the Shiller Yield (i.e. the inverted Shiller CAPE ratio) to see that it is accurate in predicting the average S&P gains over the next decade.  We also saw, however, that “accurate over ten years” is practically useless for any kind of market timing.

Now I want to look at something that is USUALLY more accurate, but has been thrown wildly off track by Quantitative Easing.

Some long time readers will remember this previous post on demographics:


On that post I gave a demographic limit for 2012 at 1346.55.

The 2012 average was a little higher at 1379.35. “A little higher” is enough to break the model, because that 1346.55 wasn’t a target, but a limit.  The S&P price violated the limit, and therefore that model is broken.

That raises two questions for me. What broke it? And, how badly did it break?

For some background into demographics and P/E ratios, there is an excellent source here:


On that site is a downloadable spreadsheet to show their methodology:


The problem with P/E ratios is that they tell you nothing about P if you don’t know E.  Just looking at the chart would lead someone to short the market – heavily – on the assumption that earnings couldn’t possibly accelerate fast enough to counteract the demographic deflation.

But earnings have done exactly that, and short positions continue to get crushed.

In any case, as I pointed out last week, P/E ratios can become predictive if they are flipped upside down into earnings yields.  The trick is in picking your time frame and the ratio that will track it, and once that ratio is fit to the past, it can be projected into the future.  If this were being used for an investment model, what I just described would be the no-no called “curve fitting.”  So, what I am about to share can’t be used in a trading or timing model.  It is just a measure of how different the price to demographic patterns are before and after Bernanke’s unprecedented series of Quantitative Easing.

The P/E to demographic fit is typically 40-49 / 60-69.  To get an expected earnings yield one would simply invert that to 60-69 / 40-49.  And that is pretty good to start, but I had to do some fine tuning to get the best fit to a ten year S&P yield:


On this graph, the red line is the expected 10 year forward S&P return with a demographic ratio of 69 / 51 year olds.

From 1975 to 1999 this ratio is an excellent fit.

And then it suddenly breaks after the 1999-2009 yield.

That break corresponds to the time of Bernanke’s Quantitative Easing.

The ten year forward S&P price yield rises from 97.23% per year in 1999-2009, to 104.61% in 2003-2013.

In other words, instead of continuing to fall in price, the S&P started going up again.

But the demographic line continues to plummet until it bottoms at an expected return rate of only 90.64% in the 2004-2014 time range.

That translates to a substantial difference in actual S&P levels in 2013:


Right now the S&P is in the mid-1600s.

But without QE the demographics show the S&P hitting 470.

That’s not 1470.  That’s 470; FOUR hundred and seventy.

It’s called depression, disaster, deflationary implosion, bread lines (no wait, food stamps…).

And if 470 isn’t bad enough, it keeps going down all the way to 390 in 2023!

The difference between present valuations and another great depression is more than 1000 points on the S&P – or better than triple what it would have been if demographics were not compensated for.

The market – ALL markets – operate on supply and demand.  The main drivers of supply and demand are the people on both sides of each transaction.  Every buyer needs a seller, and every seller needs a buyer.  There is supply and demand of available labor, management, innovation, collection and distribution of resources, skillsets, saving for retirement, and taking from retirement.  The dark side of the 1980 to 2000 baby boom market is the present 2000 to 2023 baby bust market.

Since the supply and demand of people was deflationary, Bernanke changed the supply of something else to compensate: money.

Even though Bernanke is a stock student’s nightmare, he HAS stemmed the tide… so far.

The problem now is what to do with QE.  Do we need to keep pumping the system until 2023 to maintain that blue trajectory, or do we simply stop ADDING and merely MAINTAIN the current levels until 2023?

I’ve seen both sides of the debate, and it’s possible that not even Bernanke knows the answer.

My GUESS is that we merely need to maintain current levels.  QE1 changed the S&P levels from the demographic projections to 140%.  QE2 changed it from projections to 190%.  QE3 and QE-4-ever have it at 311%.

I’ve kept the blue line at 311% of the red line, but that’s not quite right either, since there would be a dilution of the effect as the money supply continued to increase organically over the decades.

But we don’t want to STAY on that blue trajectory either, because once the demographics stabilize in 2023 there’s risk of inflation.

Wait, what?  No inflation until 2023?

Uh, no.  There’s inflation.  Just no 1970s out of control inflation until then.  This is NOT the Carter economy, but the Hoover economy hidden behind Bernanke’s helicopter.

So, we have to prevent deflation from 2009 to 2023, and prevent inflation between 2024 and 2034.  How do we do that?

Well, in theory, THAT’s when you reel in that excess money supply. 

1) You PUMP QE until the 2013 bottom (you didn’t know this has been a bear market did you?).

2) You MAINTAIN that excess money supply until 2023.

3) You REEL IN that excess money between 2024-2034 (about 0.25% of it a week).

And it looks like this:


Not bad, if you can really pull it off. 

Bernanke succeeded in phase 1, which was the easy part.

The progressively harder parts are phases 2 (in 2014) and 3 (in 2024).

I’d retire on a high note this year if I were Bernanke, which is precisely what he’s doing.

He’s a fox, that one, and a right clever one!

These effects are a lot of heavy lifting for QE.  To be honest, it’s almost unbelievable.  So, here are some caveats:

First, as we saw in the previous post, the Shiller Yield is always positive.  That’s not completely helpful, since it was positive even at the 1929 top, and that didn’t work out so well.  Nevertheless, the S&P ten year price yield has tracked the Shiller Yield projection quite closely during this recovery.

Although supply and demand have been driven by demographics in the past, that will become less true as robotics and other automated processes create slave-labor to replace human beings.  It could very well be that the demographic plunge merely forced companies to bite the bullet and invest capital in automated systems NOW because they had no other choice.  Although it is a huge investment up front, it pays off afterwards.  Thus, the plunge in 2008-2009 could have been the transitional point as capital investment overcame earnings, and the 2009-2013 run-up could be the payoff, with earnings blowing through the roof.

A good introduction to the concept can be found here:


So then, lest we pop the Champaign over earnings, we have to keep in mind that robotics only positively affects the SUPPLY side of the economy.  It ultimately erodes the DEMAND side of the economy.  The present earning margins may simply be propped up by all of that deficit spending keeping the demand side of the economy on life support.

But that’s unsustainable.  The earnings are only temporary and can last only so long as money is being given away for consumers to spend.  It’s basically the same as if you get a woman to agree to marry you with an engagement ring you bought with HER credit card.  The romance will end as soon as she gets the bill.

So, with these caveats in mind, I’m sticking with my QE theory for now.

To close, we are still left with an unanswerable question: what happens when the music stops on Dec. 31, 2013? 

Bearish case: Bernanke will be gone.  QE3 and perhaps even QE-4-ever will be gone as well. 

Bullish case: the demographic projections are both bullish.  The “with QE” projection merely continues a bull market that should finally start a life of its own.  The “without QE” projection shows an end to the bear market sector configuration I’ve noted in numerous posts, and the beginning of a normal cyclical bull.

On my sector model, we’ve continued to crawl through a bear market configuration since April 2011 (just before I gritted my teeth and launched the models with real money).  We are currently around the 3rd to 4th stage of a bear market, and on the brink of a bottom.

Yes, yes, I know – it’s bizarre to talk about a “bear market” with prices going through the roof, but that’s been Bernanke to a large extent.  The market SHOULD be ready to climb on its own now – for a few years.

None of this, and I mean NONE of this, is tradable.  QE has kept countless market timers up at night in cold sweat.

But the alternative has kept Bernanke up at night.

2014 is as good a chance for him to retire as he’ll ever get.  Then it will be someone else’s problem.  The Democrats will want to pump money too long.  The Republicans will want to reel it in too soon.  And once again only the Fed can save us.

Let’s hope Bernanke’s successor is as gifted, or lucky, as Ben has been.

Tim


Sunday, May 19, 2013

05/19/2013 No, some things do NOT make sense


Sector Model
XLB
5.74%
Large Portfolio
Date
Return
Days
BBRY
7/16/2012
101.66%
307
CAJ
9/25/2012
7.85%
236
BOKF
2/4/2013
17.87%
104
SWM
2/12/2013
26.56%
96
MWW
4/11/2013
14.96%
38
ABX
4/11/2013
-24.04%
38
TPX
4/22/2013
4.11%
27
NYCB
4/24/2013
3.61%
25
TTM
5/6/2013
4.66%
13
DLB
5/13/2013
0.35%
6
S&P
Annualized
11.53%
Sector Model
Annualized
27.16%
Large Portfolio
Annualized
33.67%
S&P
Total
23.96%
Sector Model
Total
60.47%
Large Portfolio
Total
77.05%
Sector Model
Advantage
15.63%
Large Portfolio
Advantage
22.14%


Since 5/31/2011, the large portfolio of ten stocks has risen 77.05%.

On an annualized basis (just shy of two years), that’s 33.67% per year, which is a 22.14% advantage over the S&P.

On January 1, the model had a total return of 46.63%.

Year to date, then, the model is up 20.74%.

No bragging points; the entire market has been on a tear.

And that leaves us to the question of what the market sectors are telling us.

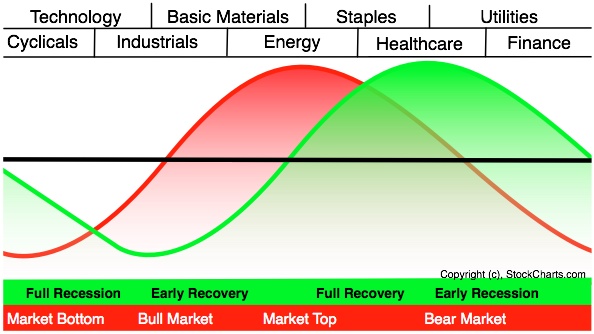
Sam Stovall has a graphic of the sector rotations embedded in a typical market cycle:


On this graphic I’ve mapped the stocks that the model has selected to their native sectors:


On the left hand side is a bull market.  On the right side is a bear.  The model appears to be targeting bullish sectors by a factor of two to one.

The average spread of ALL stocks in the model centers on a market bottom.

I mentioned this a few days ago, and I need to elaborate.  For the past two years, anyone looking at sector relationships would have been bearish almost the entire time.  For months I even listed the model as indicating a bear market, even though the market was going up almost the entire time.  I kept getting questions about it, and after the twentieth time explaining that this was some kind of extended bear market rally, I finally shrugged my shoulders and stopped listing it on the blog.

But I kept watching it, with almost a morbid curiosity, as the sectors SLOWLY ground their way from a bear market top to a cyclical bottom – which is where the model is now.

This market has been a disaster for most hedge funds, with good reason: the market hasn’t made any technical sense, outside of QE.  This has been Bernanke’s market the entire time.

In six months Bernanke will be exiting stage left, and QE will likely take a bow with him.

And yet the market is accelerating.

I believe, as I noted a few days ago, that we are entering a self sustaining cyclical bull market which will last until 2016 (earliest) to 2018 (latest).

The cause is demographics, as noted here:


and here:


The PROBLEM is whether these numbers can have any solid meaning in this environment of competitive currency devaluation.  If Bernanke has been able to turn a bear market into a four year rally, will his exit turn a bull market into a four year correction?

I don’t know.

No one knows.

Bernanke doesn’t know.  That’s why he’s happy to retire.  He’s done his job.  Now it’s up to our dysfunctional government to begin to do their job instead.

My model has been long a bear market that went up, and will be long if we have a bull market that goes down.  In a world turned on its head, traditional market timers will lose money to us dumb clods who pick undervalued stocks and grit our teeth through market gyrations cooked up in an LSD phantasm.

My point is this: don’t TRY to over-think this.  Some things do NOT make sense.

Ned Davis asked a question we should always keep in mind: “Would you rather be right, or make money?”

Most of us, believe it or not, would rather be right.  It’s not that we don’t WANT to make money, but that we want an excuse to blame when we DON’T.

Tim


Saturday, November 9, 2013

11/09/2013 The Lady or the Tiger


Sector Model
XLB
1.87%
Large Portfolio
Date
Return
Days
ABX
4/11/2013
-24.52%
212
QCOM
9/3/2013
1.77%
67
NEM
9/30/2013
-1.47%
40
BCR
10/4/2013
19.95%
36
BAX
10/7/2013
0.18%
33
BDX
10/11/2013
6.47%
29
ED
10/18/2013
1.99%
22
ISRG
10/21/2013
3.54%
19
EW
10/28/2013
-16.61%
12
FFIV
11/4/2013
3.26%
5
(Since 5/31/2011)
S&P
Annualized
11.89%
Sector Model
Annualized
24.13%
Large Portfolio
Annualized
31.05%


Rotation: selling FFIV; buying ARLP (Alliance Resource).

As I mentioned last week, the selling parameters are a ratio of:

(fundamental potential) / (current return rate). 

The current return on FFIV is an annualized rate of 942.24%... something that the fundamentals cannot sustain.

Nothing wrong with FFIV at all.  But I’ll take a little pop when it’s offered to me.

The question is – what to buy?

Well, the Sector model is in XLB (basic materials).

The Style model is in Mid Blend (basically anything).

BOTH are showing an aggressively positive configuration for the market, with a consensus target on the S&P of 1930 over the course of the next year.

So, commodity related stocks are a buy (per sector model) and stocks are a buy (per style model).

What gives?  Aren’t we overbought?  Shouldn’t we have a pullback?

We might, but a pullback is not the same thing as a bear.

Let’s revisit a post from May:


In that post we measured the effect of QE on the market against the levels it would have hit on a demographic projection.  The take away for today is that those same demographics show a bull market STARTING in 2013 and ENDING in 2018.

If QE were to continue past 2013, we would not see a continuation of the present advance, but rather an acceleration of market returns beyond 2200 on the S&P.

I say, “beyond,” because it’s impossible to say without knowing how much longer QE will continue.  2200 by 2018 is my estimate based on the PRESENT treasury balance sheet.  Additional expansion would give a higher number and create that bubble everyone has been so afraid of.

My own suggestion in May was that the Fed STOP QE in 2013, maintain the balance sheet through the next decade, and then reduce the balance by about 1% per month from 2024-2034.

That’s the ONLY way to do it without creating either an inflationary bubble (the blue line on the graph below) or a deflationary implosion (the red line on that graph).

What’s important for us today, however, is to understand that the demographics support a bull market from 2013-2018, with a normal cyclical bear starting after that.

The continuation of QE since my last post on this subject has changed the graph, but only slightly:


For the past few years I’ve been calling this a “fake bull market.”

The choice for Bernanke was either a fake bull or a real bear.  He chose the fake bull.

Now, NOW, we either get a real bull or a bubble.  Which one we get will be up to Janet Yellen.

Tim