|
Sector Model
|
XLB
|
5.74%
|
|
|
Large Portfolio
|
Date
|
Return
|
Days
|
|
BBRY
|
7/16/2012
|
101.66%
|
307
|
|
CAJ
|
9/25/2012
|
7.85%
|
236
|
|
BOKF
|
2/4/2013
|
17.87%
|
104
|
|
SWM
|
2/12/2013
|
26.56%
|
96
|
|
MWW
|
4/11/2013
|
14.96%
|
38
|
|
ABX
|
4/11/2013
|
-24.04%
|
38
|
|
TPX
|
4/22/2013
|
4.11%
|
27
|
|
NYCB
|
4/24/2013
|
3.61%
|
25
|
|
TTM
|
5/6/2013
|
4.66%
|
13
|
|
DLB
|
5/13/2013
|
0.35%
|
6
|
|
S&P
|
Annualized
|
11.53%
|
|
|
Sector Model
|
Annualized
|
27.16%
|
|
|
Large Portfolio
|
Annualized
|
33.67%
|
|
|
S&P
|
Total
|
23.96%
|
|
|
Sector Model
|
Total
|
60.47%
|
|
|
Large Portfolio
|
Total
|
77.05%
|
|
|
Sector Model
|
Advantage
|
15.63%
|
|
|
Large Portfolio
|
Advantage
|
22.14%
|
Since 5/31/2011, the large portfolio of ten stocks has risen
77.05%.
On an annualized basis (just shy of two years), that’s
33.67% per year, which is a 22.14% advantage over the S&P.
On January 1, the model had a total return of 46.63%.
Year to date, then, the model is up 20.74%.
No bragging points; the entire market has been on a tear.
And that leaves us to the question of what the market
sectors are telling us.
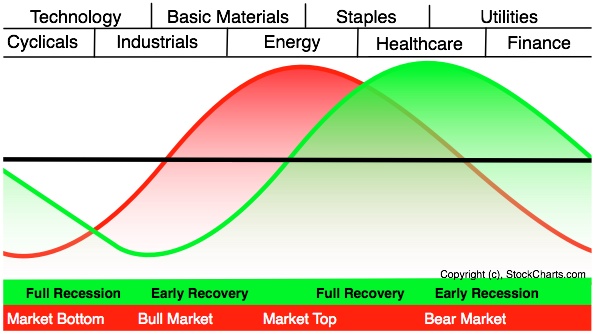
Sam Stovall has a graphic of the sector rotations embedded
in a typical market cycle:
On this graphic I’ve mapped the stocks that the model has
selected to their native sectors:

On the left hand side is a bull market. On the right side is a bear. The model appears to be targeting bullish
sectors by a factor of two to one.
The average spread of ALL stocks in the model centers on a
market bottom.
I mentioned this a few days ago, and I need to
elaborate. For the past two years,
anyone looking at sector relationships would have been bearish almost the
entire time. For months I even listed
the model as indicating a bear market, even though the market was going up
almost the entire time. I kept getting
questions about it, and after the twentieth time explaining that this was some
kind of extended bear market rally, I finally shrugged my shoulders and stopped
listing it on the blog.
But I kept watching it, with almost a morbid curiosity, as
the sectors SLOWLY ground their way from a bear market top to a cyclical bottom
– which is where the model is now.
This market has been a disaster for most hedge funds, with
good reason: the market hasn’t made any technical sense, outside of QE. This has been Bernanke’s market the entire
time.
In six months Bernanke will be exiting stage left, and QE
will likely take a bow with him.
And yet the market is accelerating.
I believe, as I noted a few days ago, that we are entering a
self sustaining cyclical bull market which will last until 2016 (earliest) to
2018 (latest).
The cause is demographics, as noted here:
and here:
The PROBLEM is whether these numbers can have any solid
meaning in this environment of competitive currency devaluation. If Bernanke has been able to turn a bear
market into a four year rally, will his exit turn a bull market into a four
year correction?
I don’t know.
No one knows.
Bernanke doesn’t know.
That’s why he’s happy to retire.
He’s done his job. Now it’s up to
our dysfunctional government to begin to do their job instead.
My model has been long a bear market that went up, and will
be long if we have a bull market that goes down. In a world turned on its head, traditional
market timers will lose money to us dumb clods who pick undervalued stocks and
grit our teeth through market gyrations cooked up in an LSD phantasm.
My point is this: don’t TRY to over-think this. Some things do NOT make sense.
Ned Davis asked a question we should always keep in mind: “Would
you rather be right, or make money?”
Most of us, believe it or not, would rather be right. It’s not that we don’t WANT to make money,
but that we want an excuse to blame when we DON’T.
Tim
Is the calculation of the average spread calculated on an angular rather than linear scale (i.e. placing the model stocks on the full cycle modelled as a circle)? Also, is there a possible skew due to a phase shift whereby stocks "anticipate" the economy ahead (some say by 6 months)?
ReplyDeleteGood question. Most uses of Stovall's cycle analysis simply try to jump into the CURRENT point in the cycle based on simple momentum. So, if financials are accelerating they will say, "we are in the financial point of the cycle, so jump into financials." The problem is that the price is already baked in, and this is no better than saying "let's jump into whatever moved up most recently." My model invests in where the market is likely to go next -- although as you can see the full model isn't a very well defined cluster. Instead of positive momentum, I look for negative momentum with positive breadth and volume... kind of like watching the water recede on the beach in preparation for the next incoming wave.
ReplyDelete